AutoWorldModel-Bench

A Benchmark for Automated World Model Research on Structured Entity-Component State

Abstract

World modeling is an unsettled field: architectures, training objectives, and state representations interact in complex ways, and no single recipe dominates across environments. This makes it an ideal testbed for AI coding agents acting as autonomous researchers, a setting in which the improvement direction is not specified in advance, unlike the engineering-to-spec tasks that dominate current agent benchmarks. We introduce AutoWorldModel-Bench, a closed-loop benchmark in which frontier coding agents autonomously improve a provided world-model starter under a fixed compute budget. The benchmark spans eight game environments under a unified structured-state representation: ground-truth entity state extracted from each game and consumed through a shared tensor format, which isolates dynamics modeling from perception and enables minutes-per-run iteration. Across 64 sessions, Codex 5.4 and Opus 4.6 improve their starter on 63; in 91% of sessions, the winning edit is a non-trivial research-style modification, such as a new objective, representation, rollout procedure, or architectural change, rather than a hyperparameter tweak. WorldModel-Bench offers a setting in which frontier coding agents can be evaluated on open-ended research rather than engineering-to-spec problems.
Key Numbers

63 / 64
Sessions improved
paired test-score lift over the starter
+0.196
Mean $\Delta$ test score
across 64 agent×starter×game sessions
+0.249
$\Delta$ at $h=20$
long-horizon rollout gain (in-session)
91%
Non-trivial winners
session winners that are new objectives, losses, rollouts or architectures (not hyperparameter tweaks)
1.8×
Token efficiency
Codex is more token-efficient per unit $\Delta$ score

See Main Results for the per-session breakdown.

Games

8 games with diverse entity dynamics, ranging from 5 to 52 entities per frame.

🚀

Asteroids

20 entities · age, hp, size_class

🧱

Breakout

52 entities · col, hp, row

🐸

Frogger

28 entities · lane_type, reached

🐵

Kong

16 entities

🏃

Platformer

24 entities · on_ground

🏓

Pong

5 entities

🚗

Racer

6 entities

🐍

Snake

48 entities · direction, segment_index

Data Preview

A sample episode from each game, rendered from the raw ECS state that ships in the dataset. Pick a game to play its clip.

Each clip is a short rollout recorded from the game simulator. Every frame shown is directly derivable from the structured entity state stored in the released Parquet files.

Baseline Models

Four diverse architectures covering the major paradigms in generative world modeling.

Dreamer

Continuous, recurrent world model based on DreamerV3-style RSSM with discrete categorical latent space (32×32).

Continuous Recurrent

AR-Transformer

Autoregressive Transformer with temporal context encoder for continuous entity state prediction.

Continuous Attention

D3PM

Discrete Denoising Diffusion Probabilistic Model with temporal cross-attention for structured state prediction.

Discrete Diffusion

MaskGIT

Masked Generative Transformer with iterative parallel decoding for discrete token-based world modeling.

Discrete Masked

Evaluation Protocol

Three evaluation modes

Teacher-forced ($h = 1$)

Model receives ground-truth $s_{t}$ and predicts $\hat{s}_{t+1}$. Isolates single-step dynamics accuracy from error accumulation.

Open-loop rollout ($h > 1$)

Given $s_{0}$ and a recorded action sequence, predict $(\hat{s}_{1}, \ldots, \hat{s}_{T})$ autoregressively at $h \in \{10, 20\}$. Measures error compounding.

Scenario tests

Per-game probes of whether the model learns game rules (collision, scoring, terminal). Controlled initial state + deterministic action sequence; predictions checked against ground truth.

Per-horizon composite

At each horizon $h$ we measure two quantities:

  • Position L1 — mean $L_{1}$ error on mutable entity positions (normalized to $[0, 1]$; lower is better).
  • Alive F1 — $F_{1}$ score on the entity alive/dead flag (higher is better).

$c_{h} = 0.9\,(1 - \text{PositionL1}_{h}) + 0.1\,\text{AliveF1}_{h}$

Position L1 carries the dominant dynamical signal; Alive F1 guards against trivial solutions that predict every entity as alive.

Final score

Test score: $S_{\text{test}} = 0.1\,c_{1} + 0.2\,c_{10} + 0.7\,c_{20}$

Scenario score: $S_{\text{scenario}} = 0.1\,c_{1} + 0.2\,c_{10} + 0.7\,c_{h_{\text{end}}}$

Both formulas share the same per-horizon composite $c_{h}$; they differ only in the long-horizon term. The scenario score evaluates at the full episode length ($h_{\text{end}}$) rather than at a truncated 20-step horizon, tightening the test on long-horizon rule consistency. During a session the agent sees the test-style validation score to guide search; after the session, both formulas are recomputed on their respective held-out splits.

Data splits: test and scenario

Trajectories are partitioned into training, validation, test, and scenario splits. Agents have read-only access to training and validation during their session; test and scenario are held out and used only for post-session evaluation. The best checkpoint is selected by validation performance and evaluated exactly once on each held-out split.

Test score. Final score recomputed on held-out i.i.d. trajectories drawn from the same distribution as training. This is the primary headline number throughout the paper.

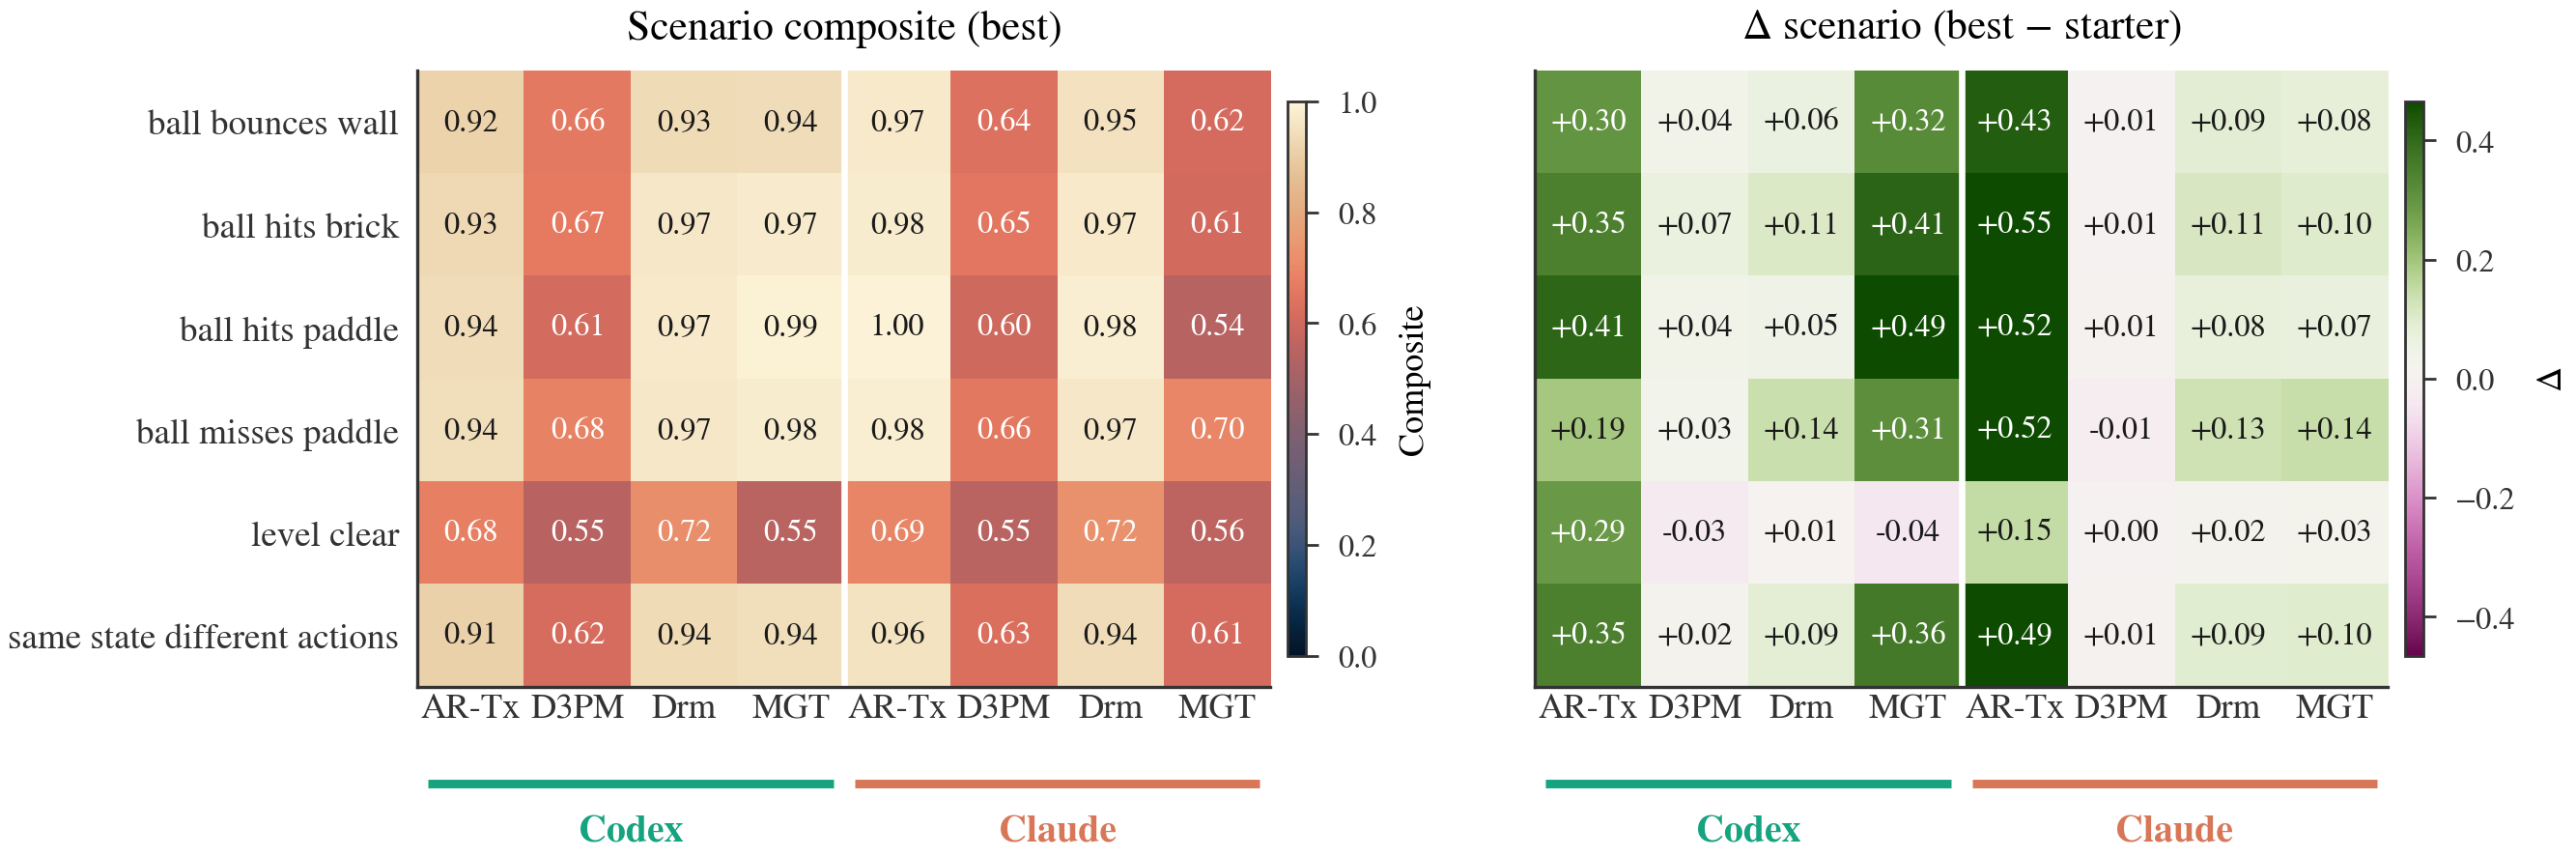
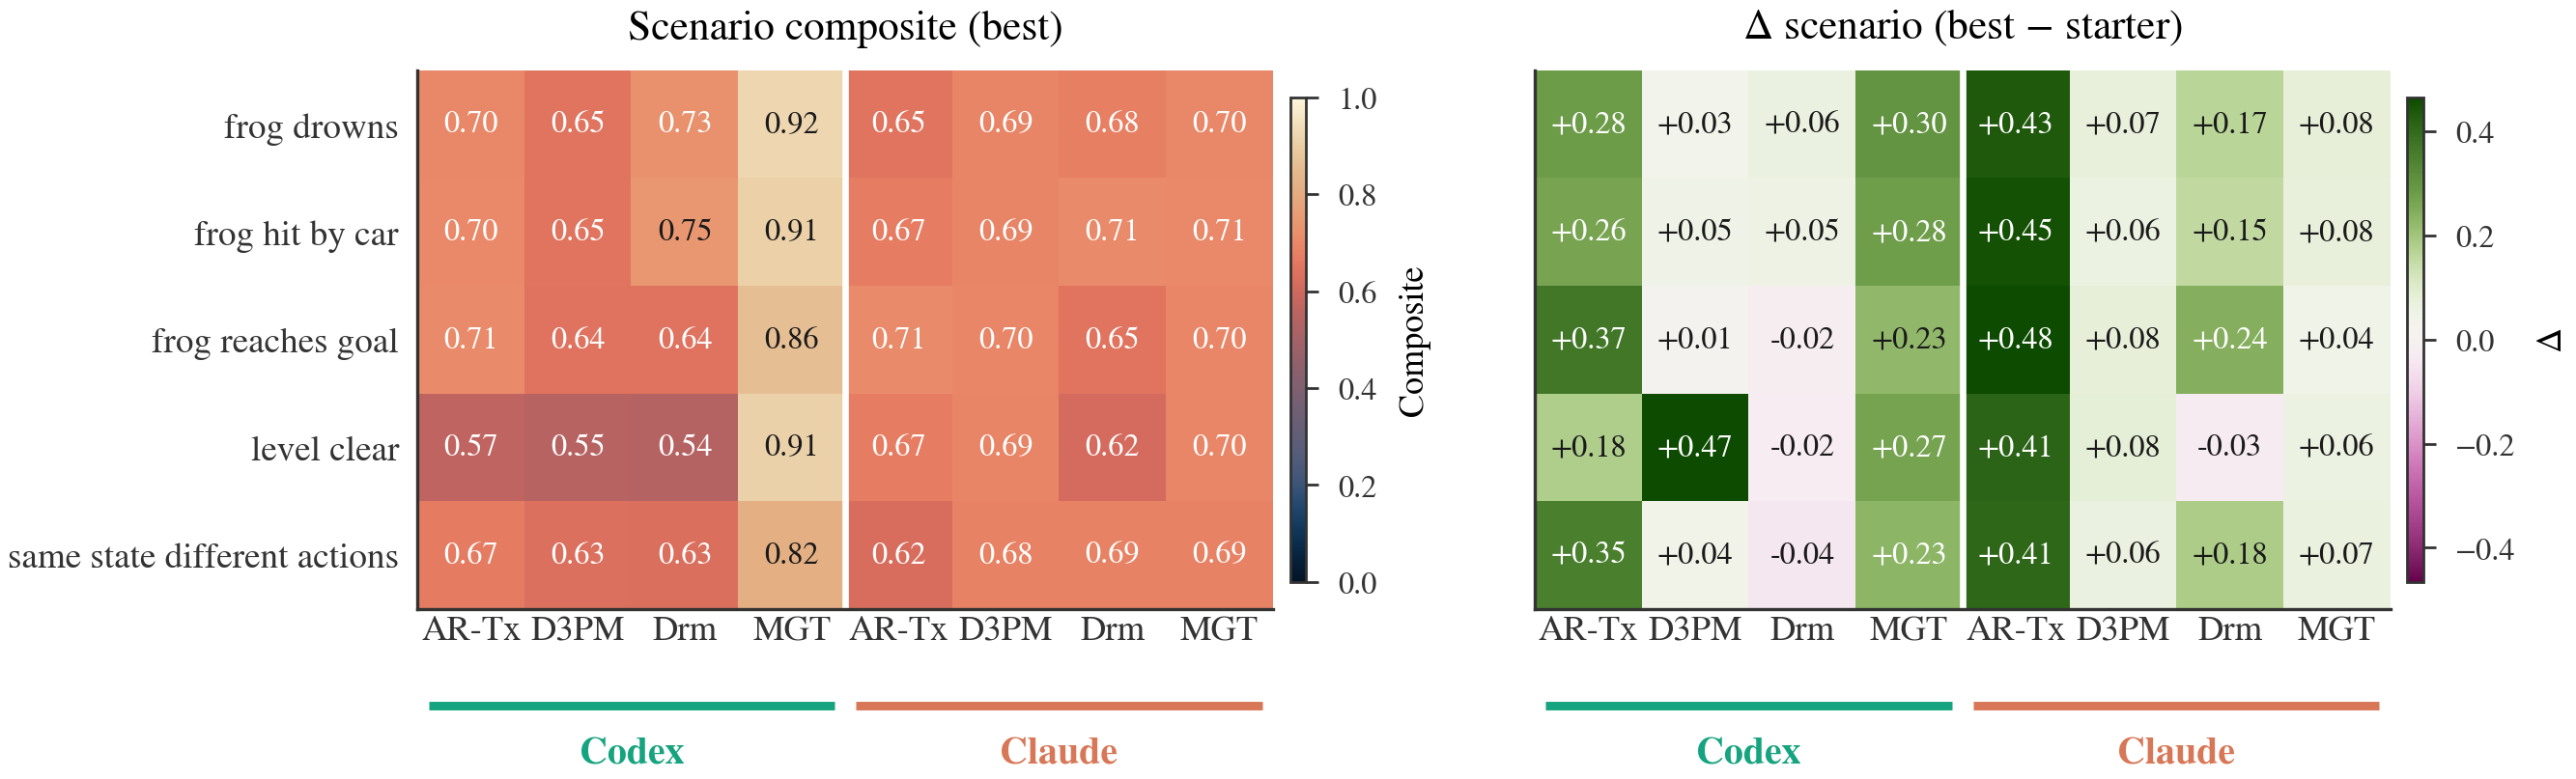
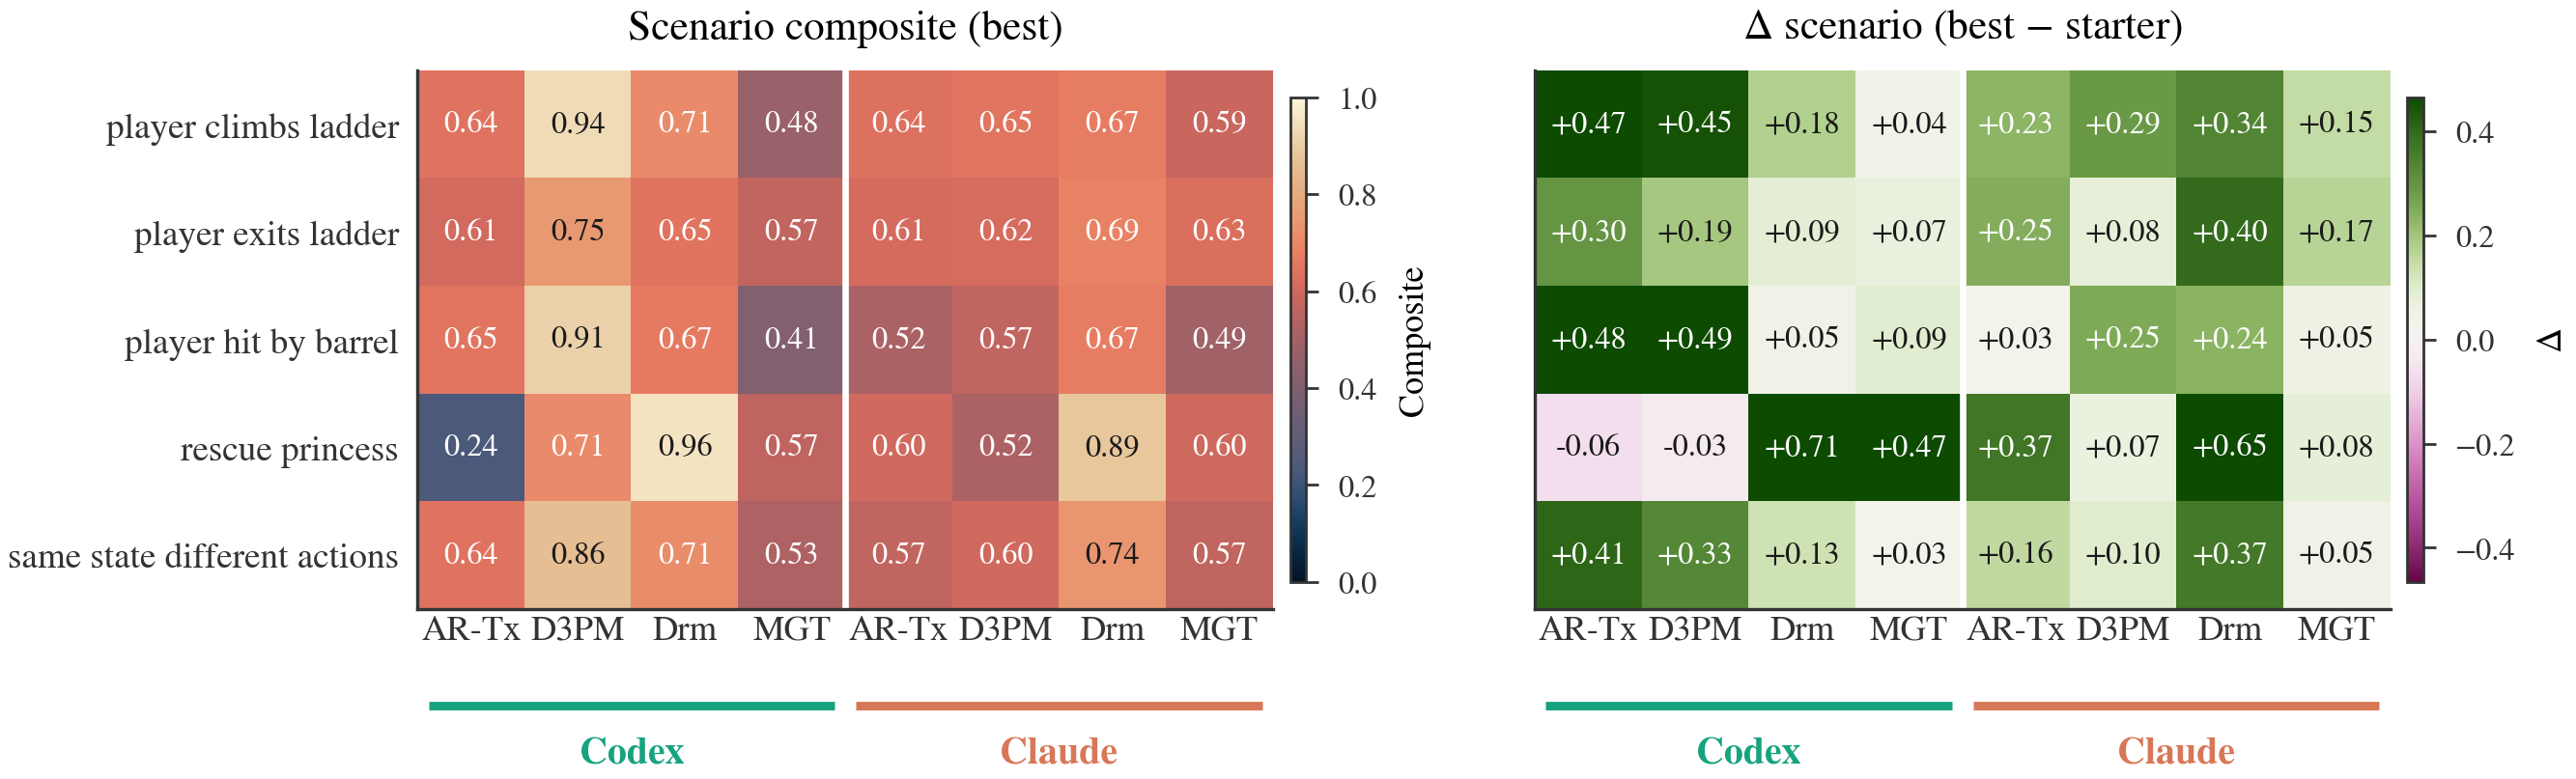
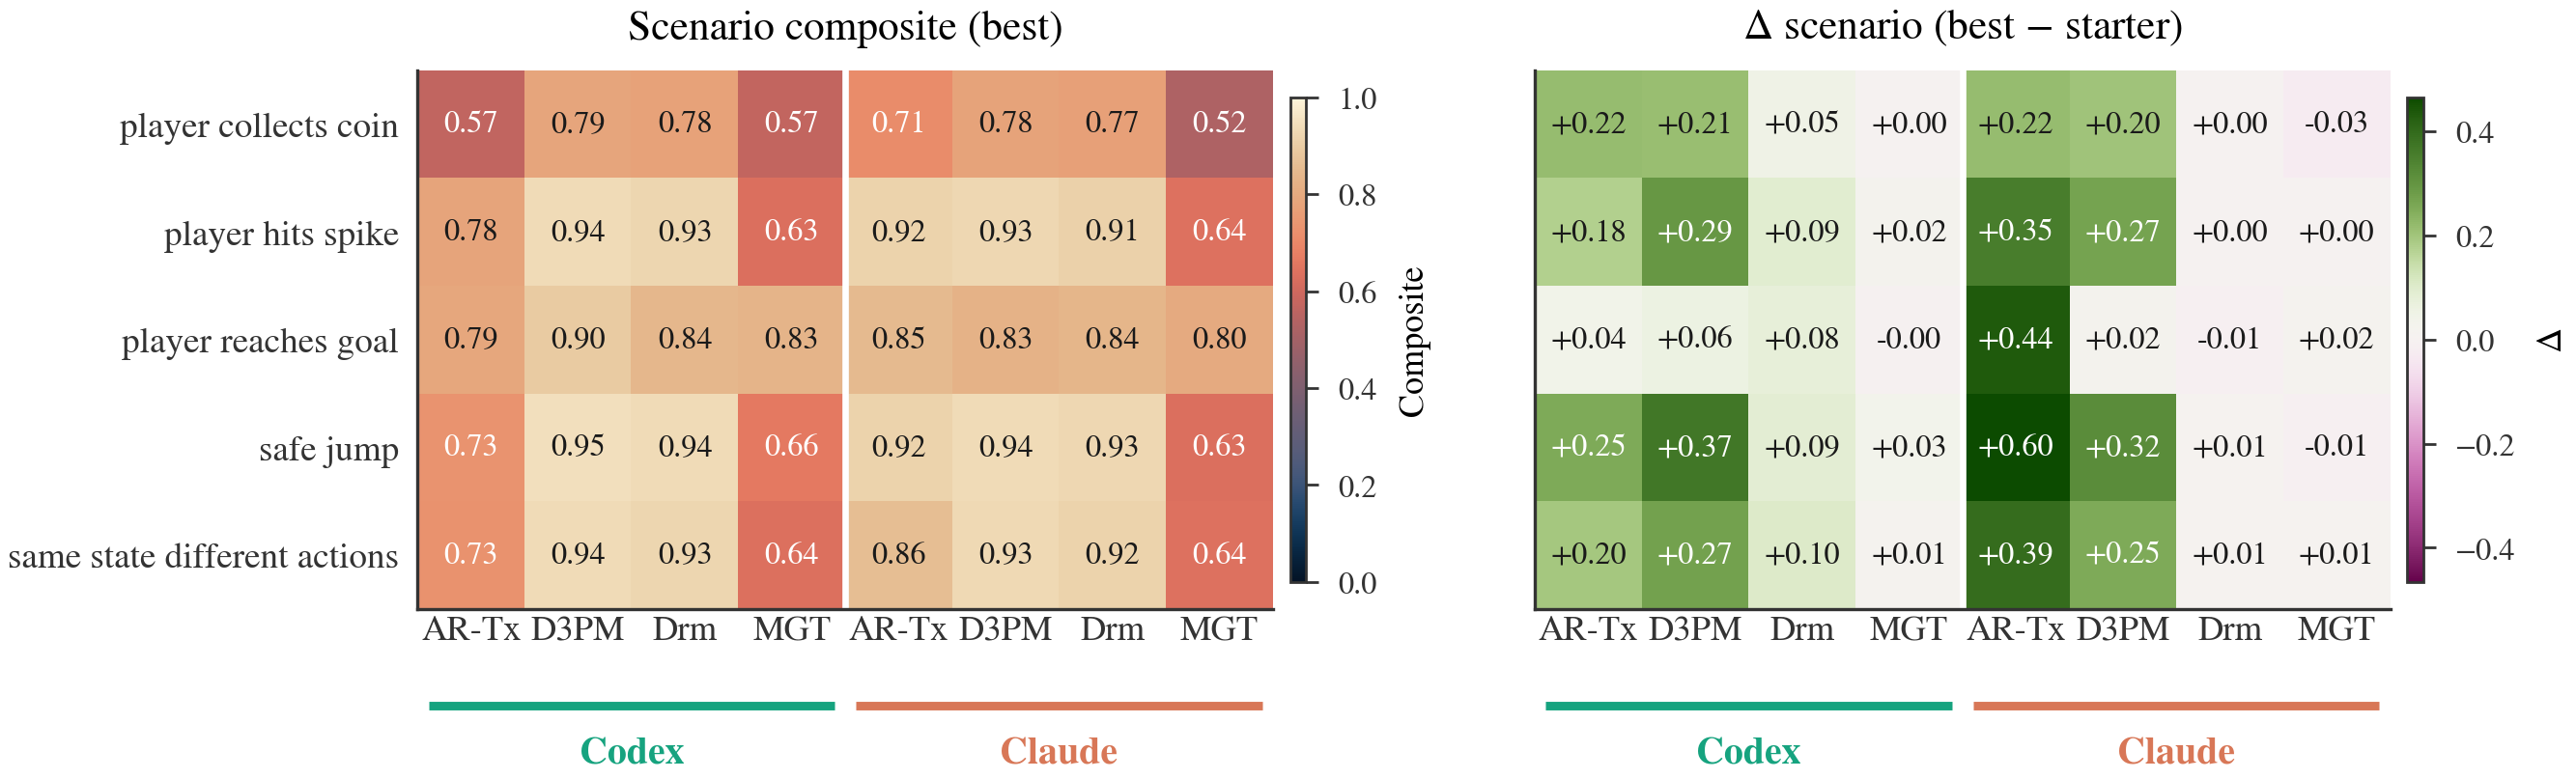
Scenario score. Formula above applied to a hand-curated suite of 60 scenario groups across the 8 games (1,860 episodes). Each scenario constructs a controlled initial state that isolates a specific game rule — e.g. ball–paddle collision, frog drowning, bullet wrapping — and pairs it with a deterministic action sequence.

Why both. Test score measures distributional fit; scenario score measures whether the model captures mechanics that matter for planning at full episode length. Across the 64 agent sessions, the two lifts agree in direction on 55 / 64 tasks ($r = 0.89$).

Main Results

Per-(game, starter) held-out lift on test and scenario splits, with per-agent columns. Mirrors Table 2 of the paper.

Game Starter Starter (test) Best (test) $\Delta$ test $\Delta$ scenario
OpusCodex OpusCodex OpusCodex OpusCodex
Asteroids Dreamer 0.09 0.09 0.69 0.71 +0.60 +0.61 +0.42 +0.43
AR-Transformer 0.10 0.10 0.70 0.68 +0.60 +0.59 +0.47 +0.43
D3PM 0.32 0.30 0.52 0.64 +0.20 +0.34 +0.21 +0.31
MaskGIT 0.38 0.33 0.55 0.46 +0.16 +0.13 +0.20 +0.16
Breakout Dreamer 0.94 0.94 0.97 0.97 +0.03 +0.03 +0.09 +0.08
AR-Transformer 0.73 0.69 0.99 0.98 +0.26 +0.29 +0.44 +0.31
D3PM 0.66 0.65 0.66 0.68 -0.00 +0.03 +0.00 +0.03
MaskGIT 0.59 0.62 0.66 0.98 +0.07 +0.36 +0.09 +0.31
Frogger Dreamer 0.69 0.71 0.74 0.78 +0.05 +0.07 +0.14 +0.01
AR-Transformer 0.24 0.41 0.72 0.75 +0.48 +0.34 +0.44 +0.29
D3PM 0.65 0.64 0.72 0.67 +0.07 +0.03 +0.07 +0.12
MaskGIT 0.67 0.66 0.73 0.93 +0.07 +0.28 +0.06 +0.26
Kong Dreamer 0.50 0.78 0.83 0.84 +0.33 +0.06 +0.40 +0.23
AR-Transformer 0.59 0.37 0.78 0.84 +0.18 +0.48 +0.21 +0.32
D3PM 0.47 0.49 0.61 0.96 +0.14 +0.47 +0.16 +0.29
MaskGIT 0.50 0.48 0.57 0.61 +0.07 +0.12 +0.10 +0.14
Platformer Dreamer 0.95 0.92 0.96 0.96 +0.01 +0.04 +0.01 +0.08
AR-Transformer 0.72 0.73 0.96 0.85 +0.24 +0.12 +0.40 +0.18
D3PM 0.62 0.64 0.97 0.97 +0.35 +0.33 +0.21 +0.24
MaskGIT 0.59 0.59 0.62 0.62 +0.03 +0.03 +0.00 +0.01
Pong Dreamer 0.88 0.88 0.95 0.95 +0.07 +0.07 -0.00 -0.03
AR-Transformer 0.76 0.85 0.88 0.87 +0.11 +0.01 +0.25 -0.00
D3PM 0.77 0.76 0.80 0.79 +0.03 +0.04 +0.04 +0.04
MaskGIT 0.68 0.76 0.98 0.95 +0.29 +0.20 +0.25 +0.12
Racer Dreamer 0.68 0.69 0.71 0.75 +0.04 +0.06 +0.00 -0.02
AR-Transformer 0.50 0.53 0.74 0.73 +0.24 +0.20 +0.28 +0.17
D3PM 0.62 0.62 0.64 0.64 +0.02 +0.01 +0.03 -0.03
MaskGIT 0.62 0.61 0.64 0.63 +0.02 +0.02 +0.02 +0.02
Snake Dreamer 0.10 0.10 0.61 0.64 +0.51 +0.54 +0.36 +0.44
AR-Transformer 0.10 0.10 0.59 0.83 +0.49 +0.74 +0.37 +0.43
D3PM 0.47 0.50 0.53 0.54 +0.05 +0.04 -0.01 -0.00
MaskGIT 0.50 0.43 0.53 0.48 +0.03 +0.05 -0.15 +0.00

Each (game, starter) row shows the starter score and the agent-best score separately for Opus-4.6 and Codex-5.4, because each agent sees its own starter re-run on the shared host (platform non-determinism; see paper §C.7). $\Delta$ test is weighted $0.1\,c_{1} + 0.2\,c_{10} + 0.7\,c_{20}$, blue (+) / crimson (–). $\Delta$ scenario is the same formula with $c_{h_{\text{end}}}$ in place of $c_{20}$, amber (+) / violet (–).


Opus vs. Codex

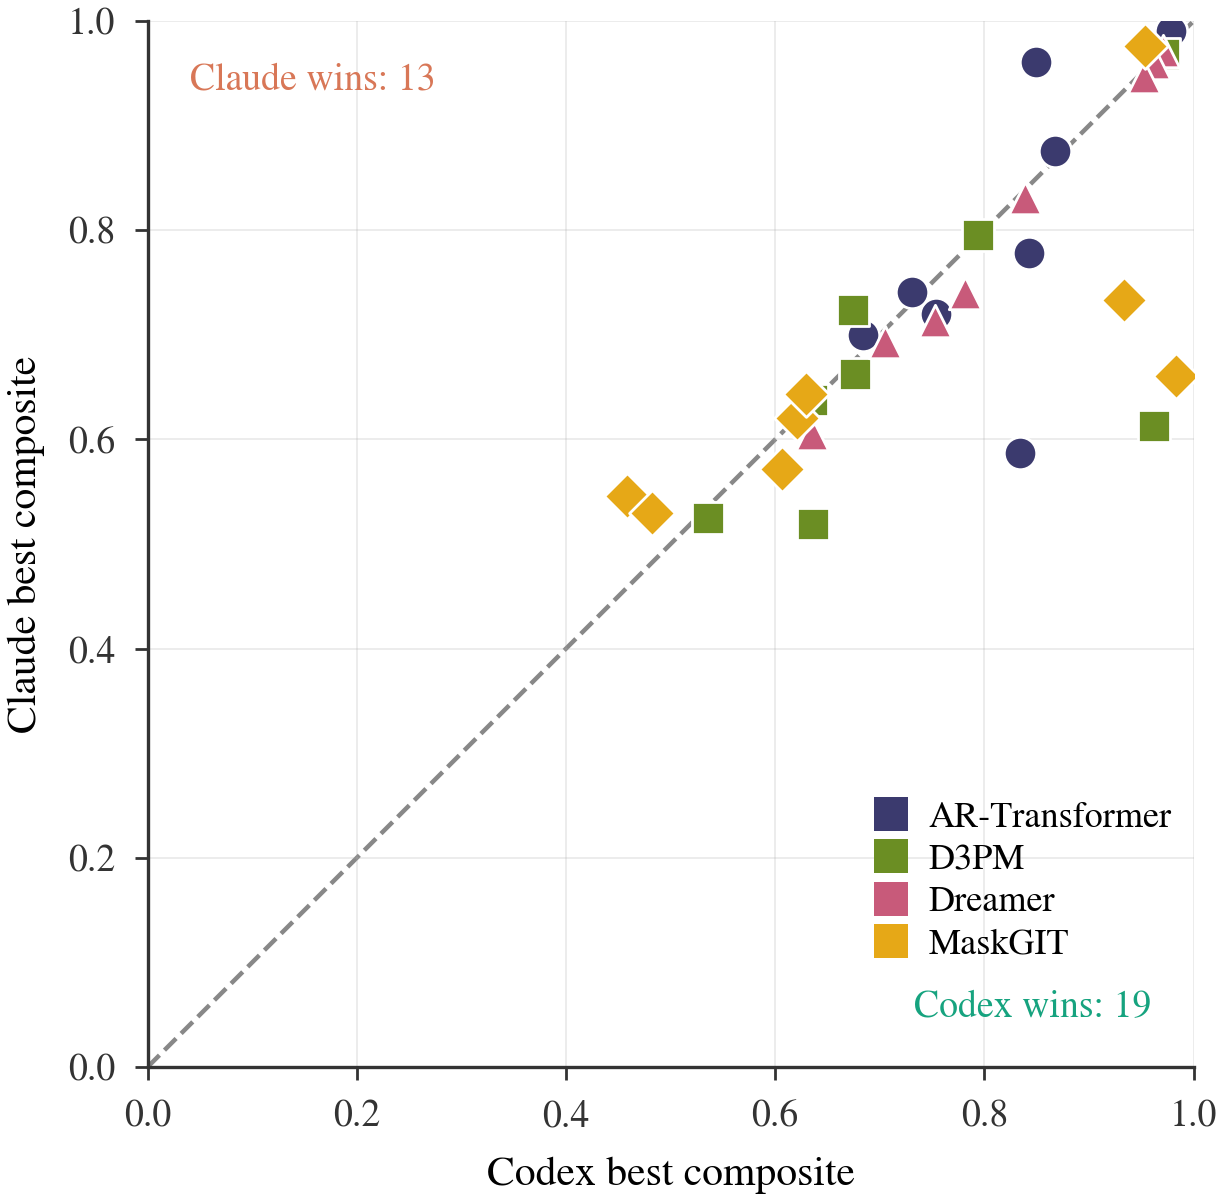
Per-task scatter of agent-best composite: Codex on the x-axis, Opus on the y-axis. Points on the diagonal indicate a tie.

Opus vs Codex

Win split at the task level: Codex 19, Opus 13 (paired Wilcoxon p = 0.15).


Long-Horizon Gains

Decomposing the mean test composite across the three rollout horizons. Starter is already strong at $h=1$; almost all of the agent's uplift comes from $h=10$ and $h=20$.

HorizonStarterAgent best$\Delta$
$h=1$ 0.813 0.864 +0.05
$h=10$ 0.578 0.788 +0.21
$h=20$ 0.488 0.737 +0.25

Starter vs. agent-best mean composite at each evaluation horizon.


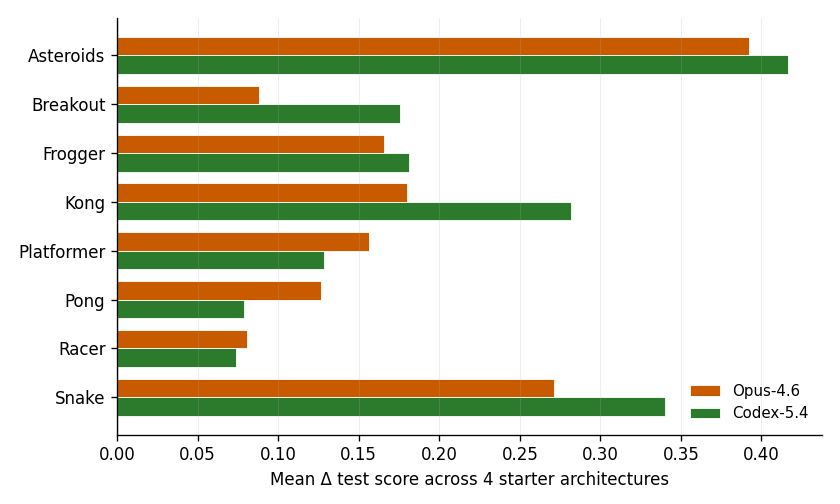
Per-Game Uplift

Per-game uplift

Mean $\Delta$ test score across the four starter architectures, per game and agent.


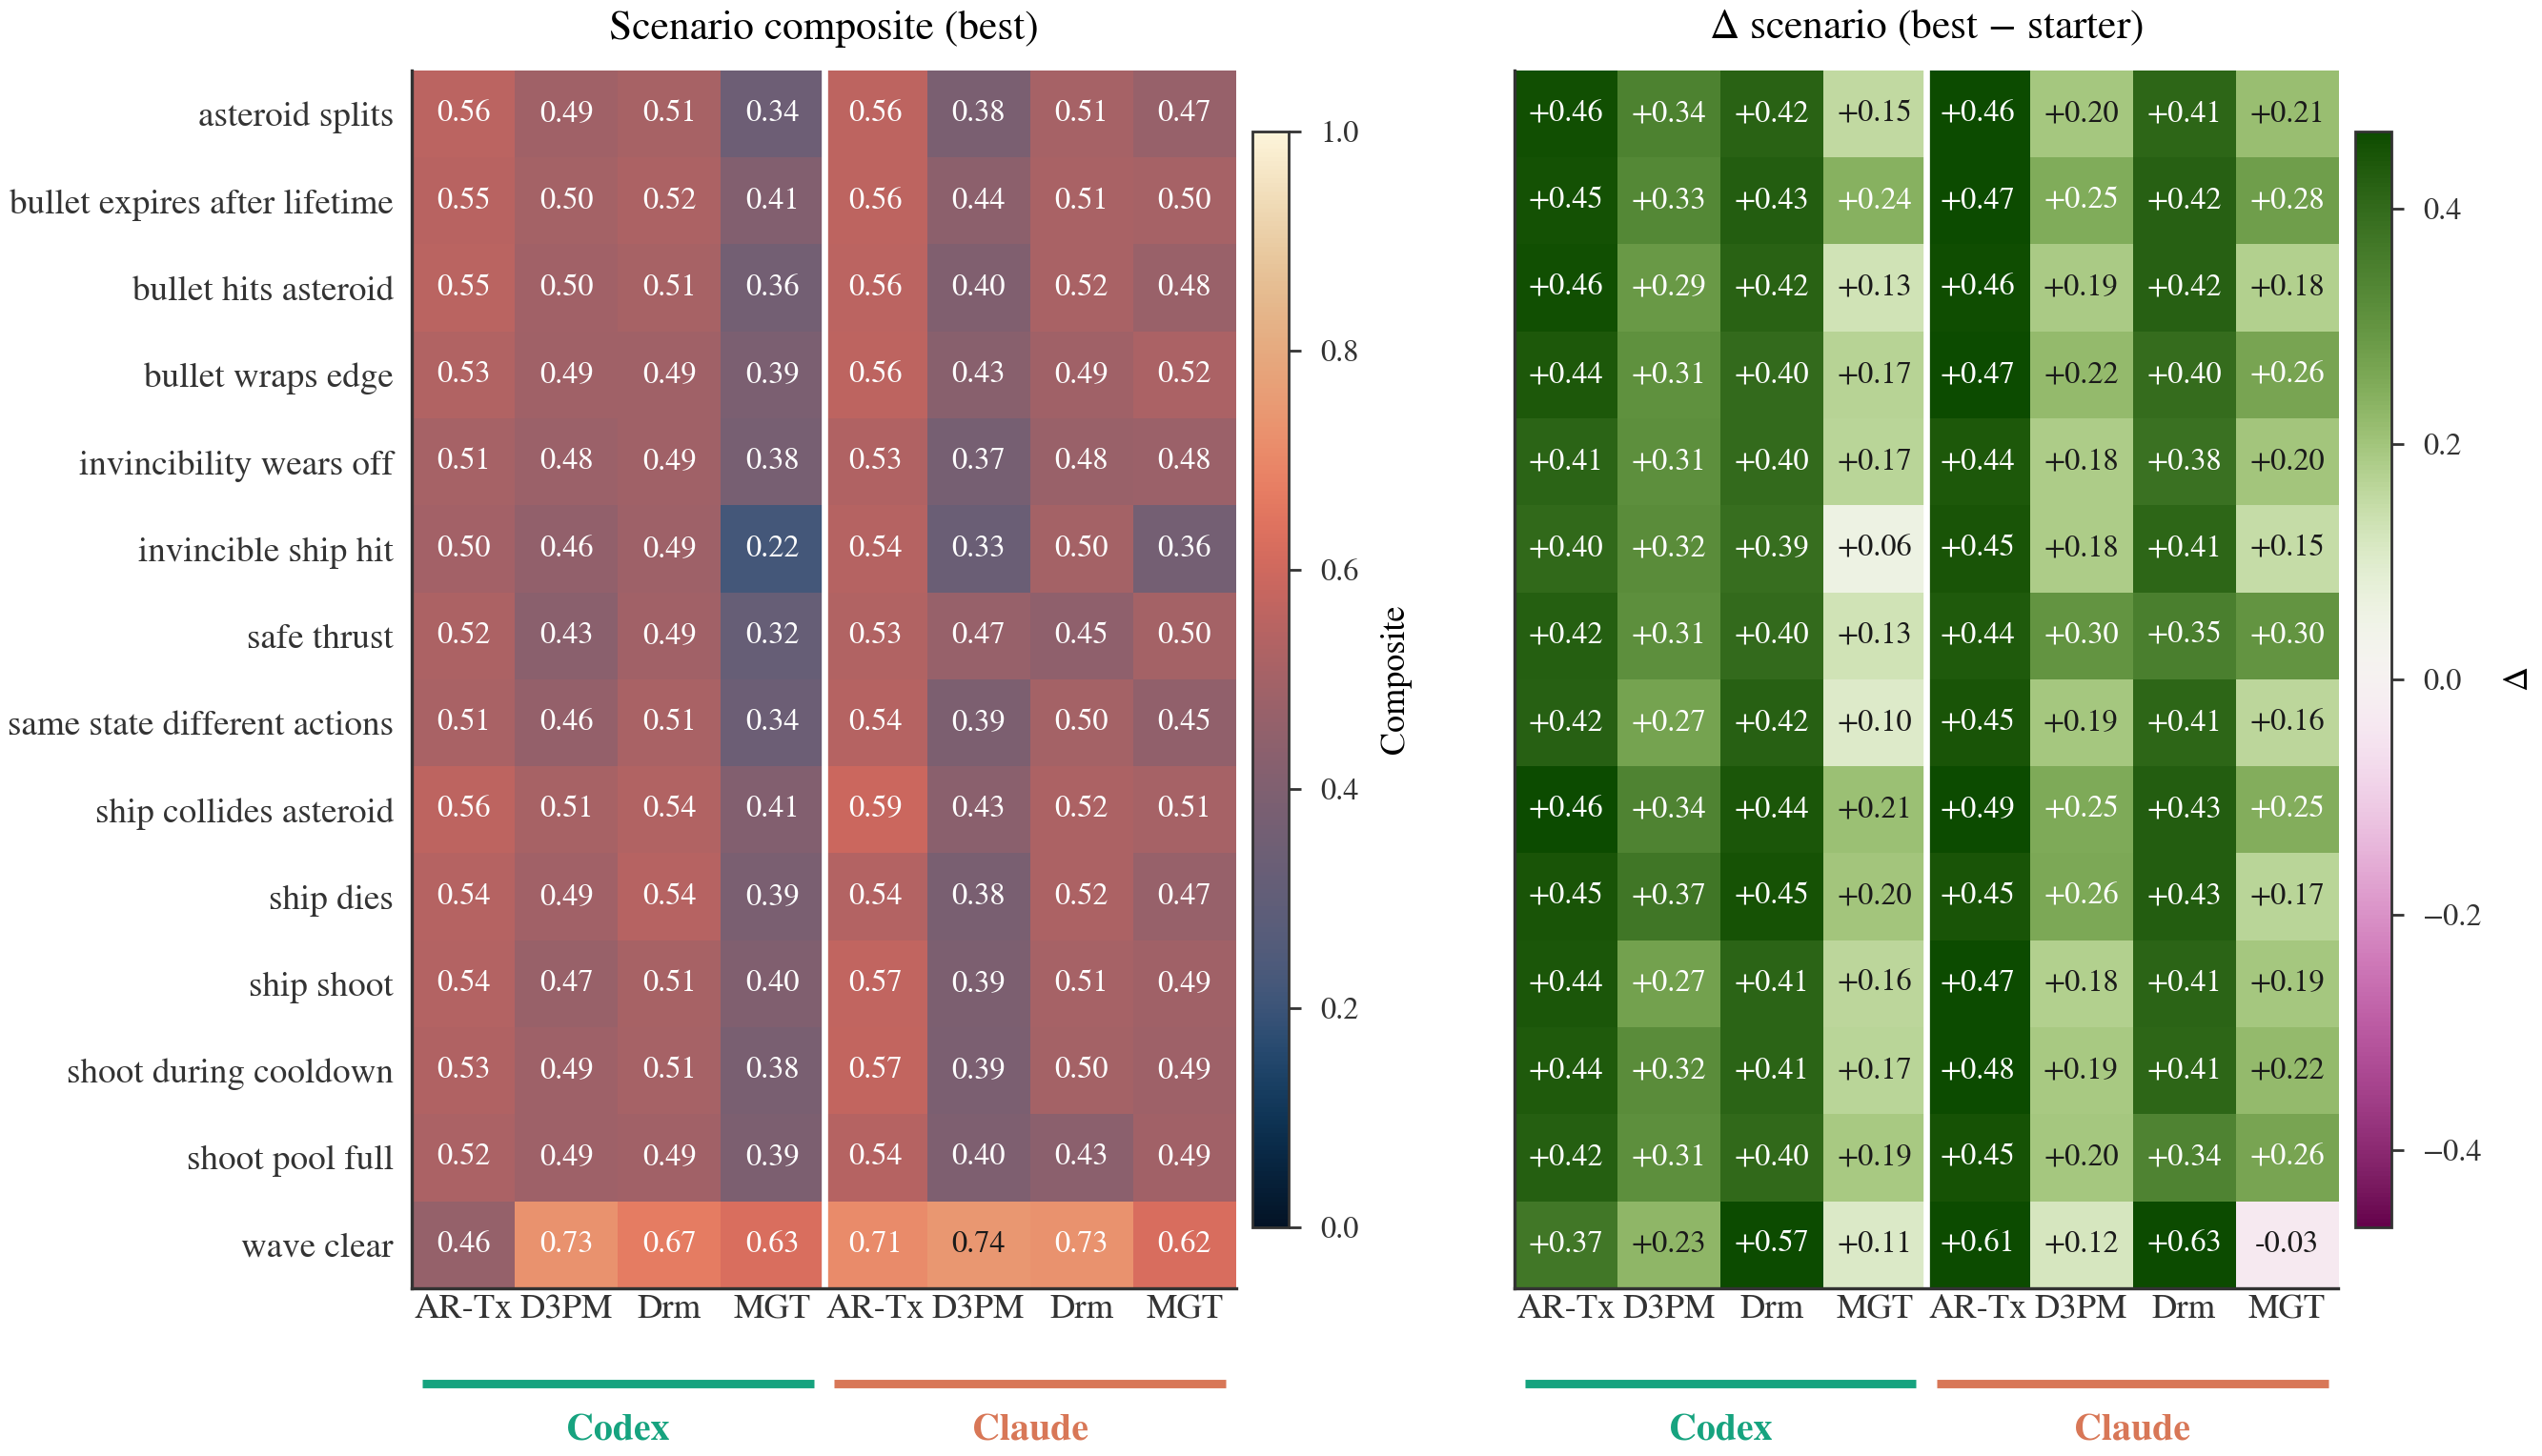
Per-Game Scenario Suite

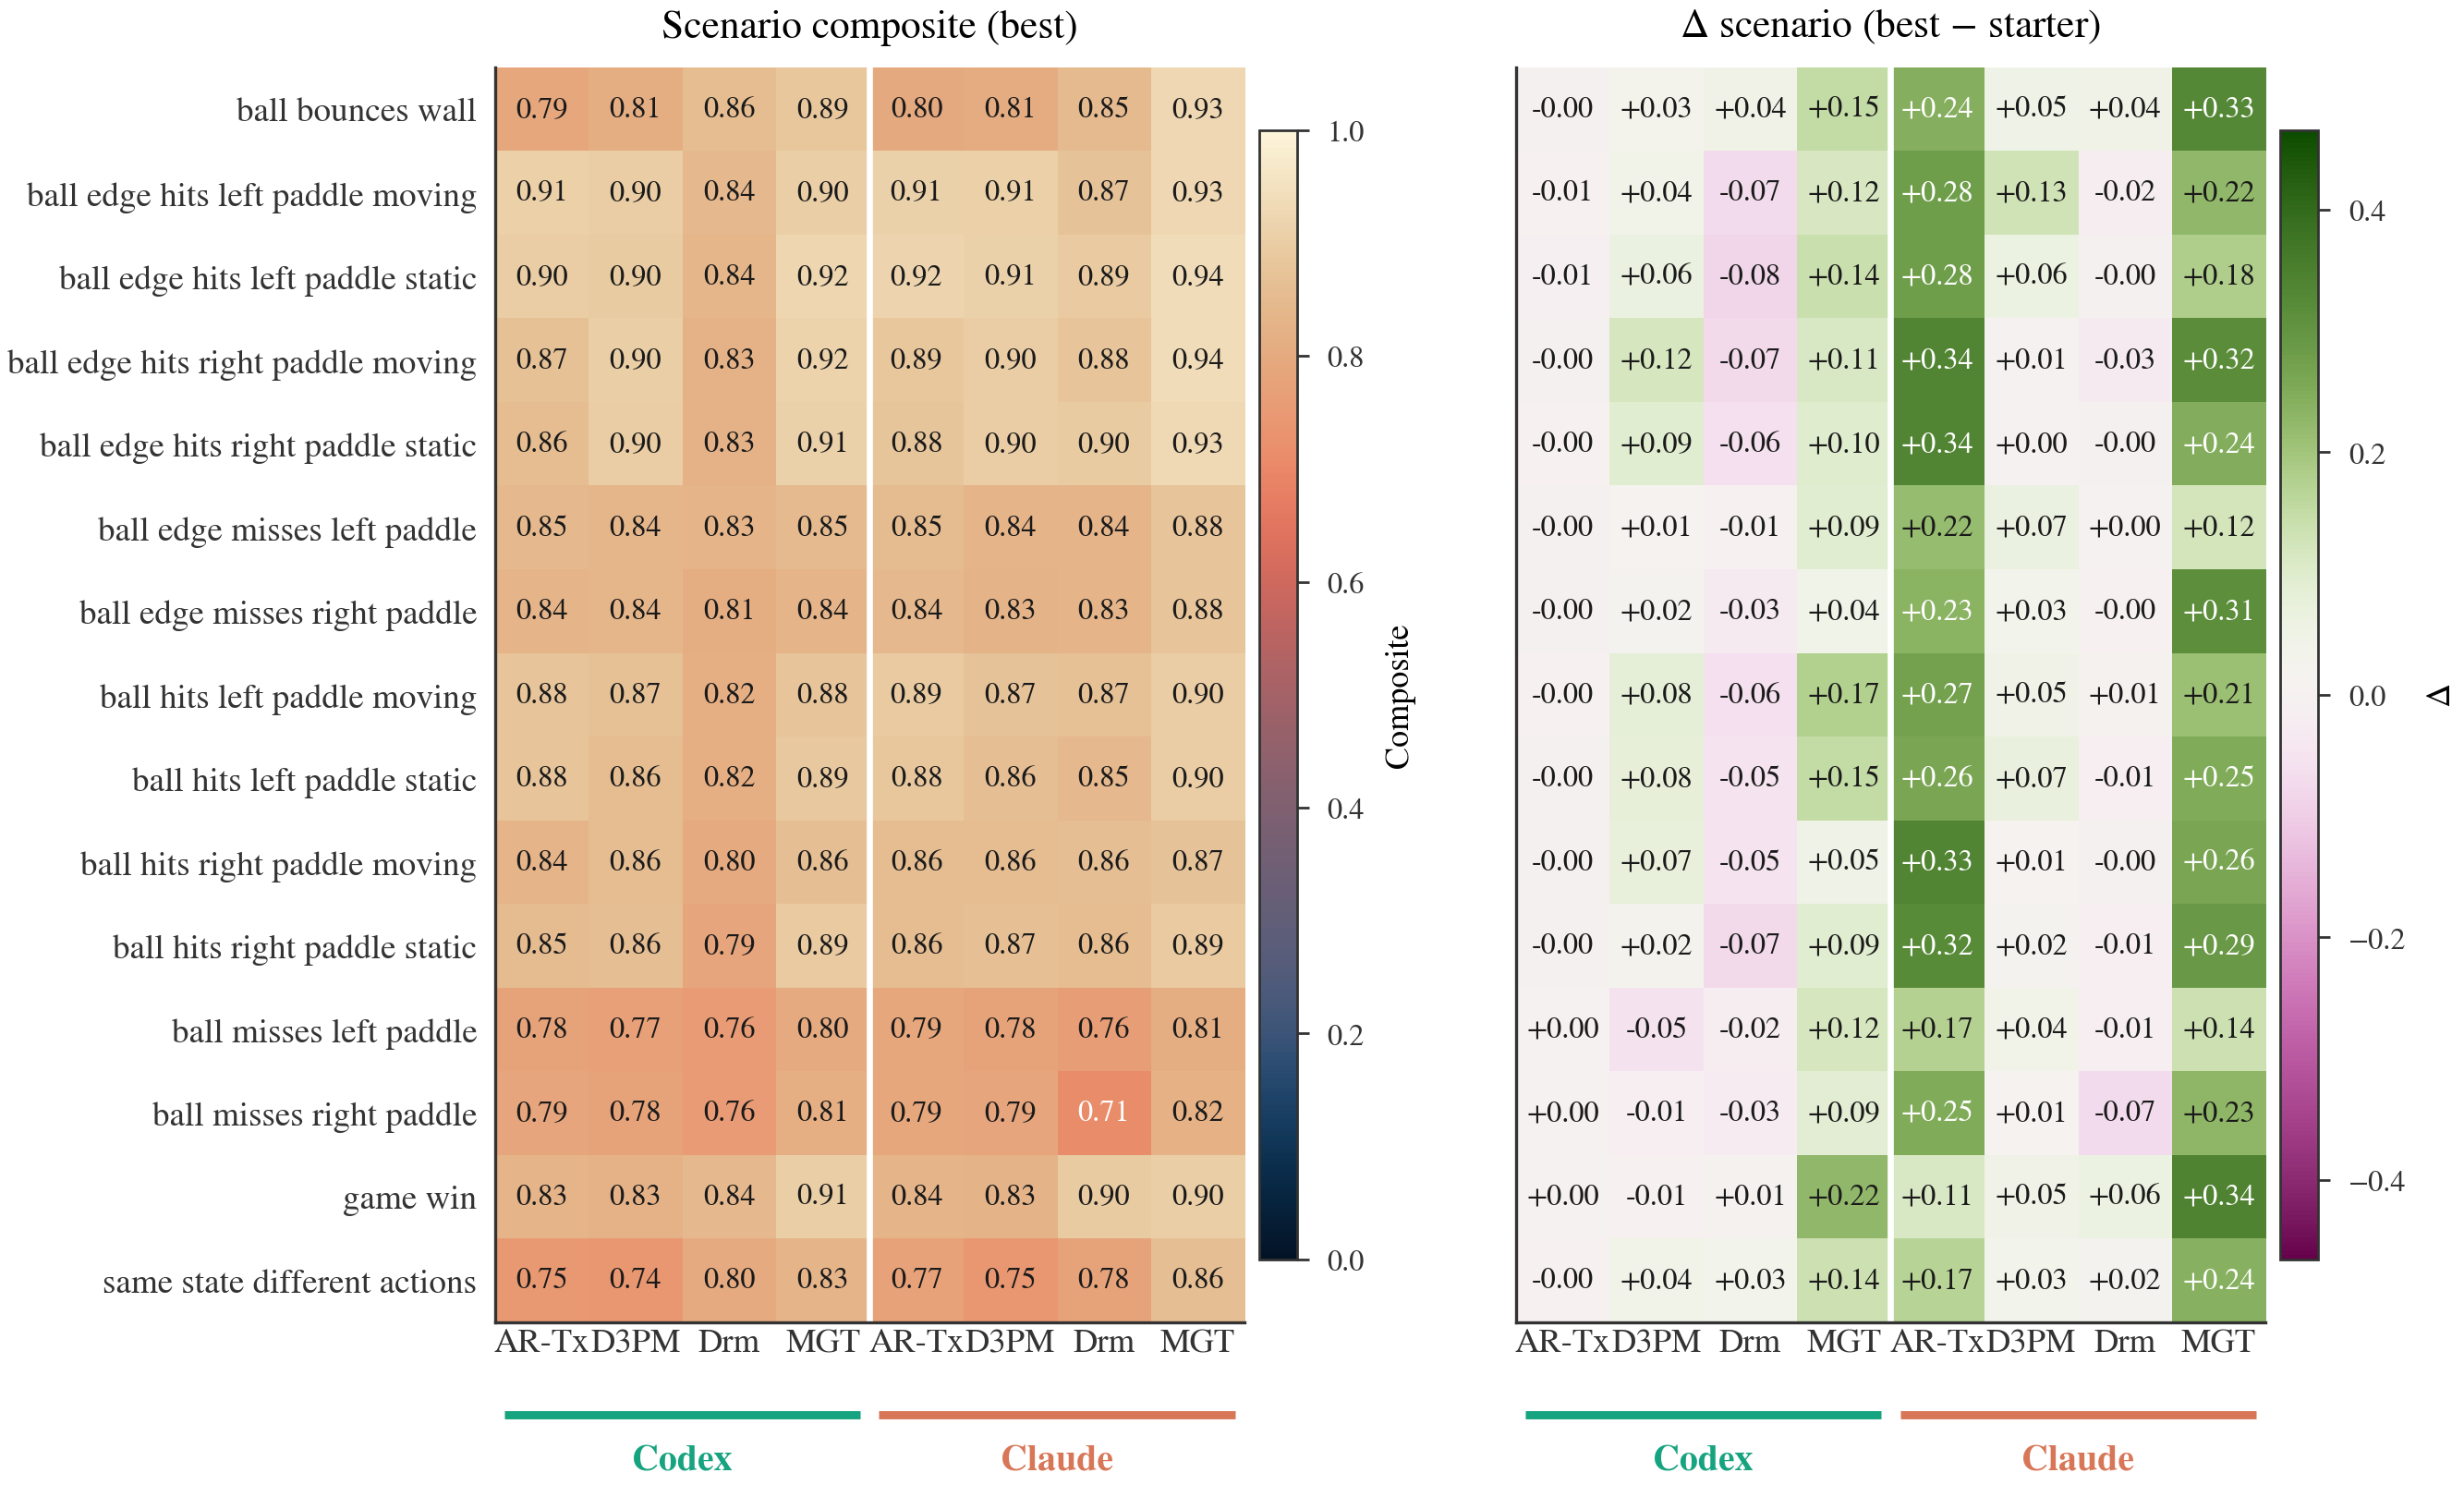
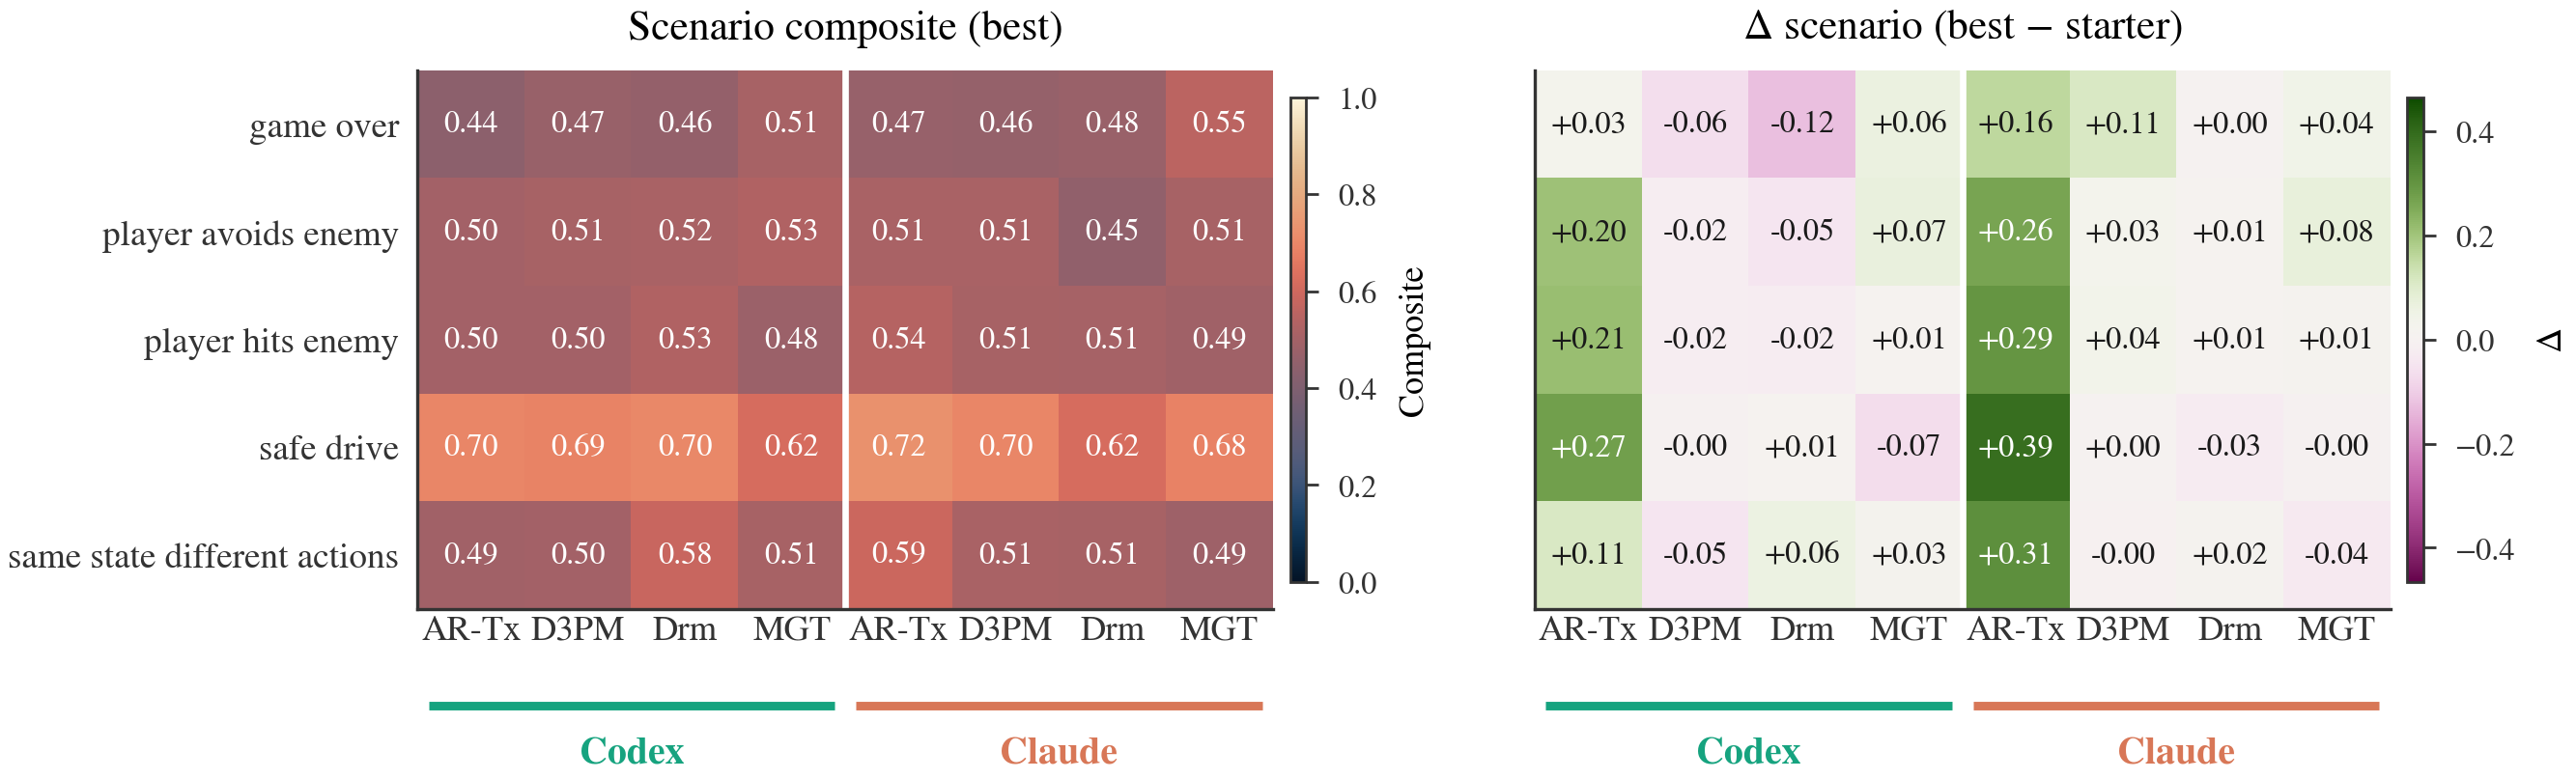
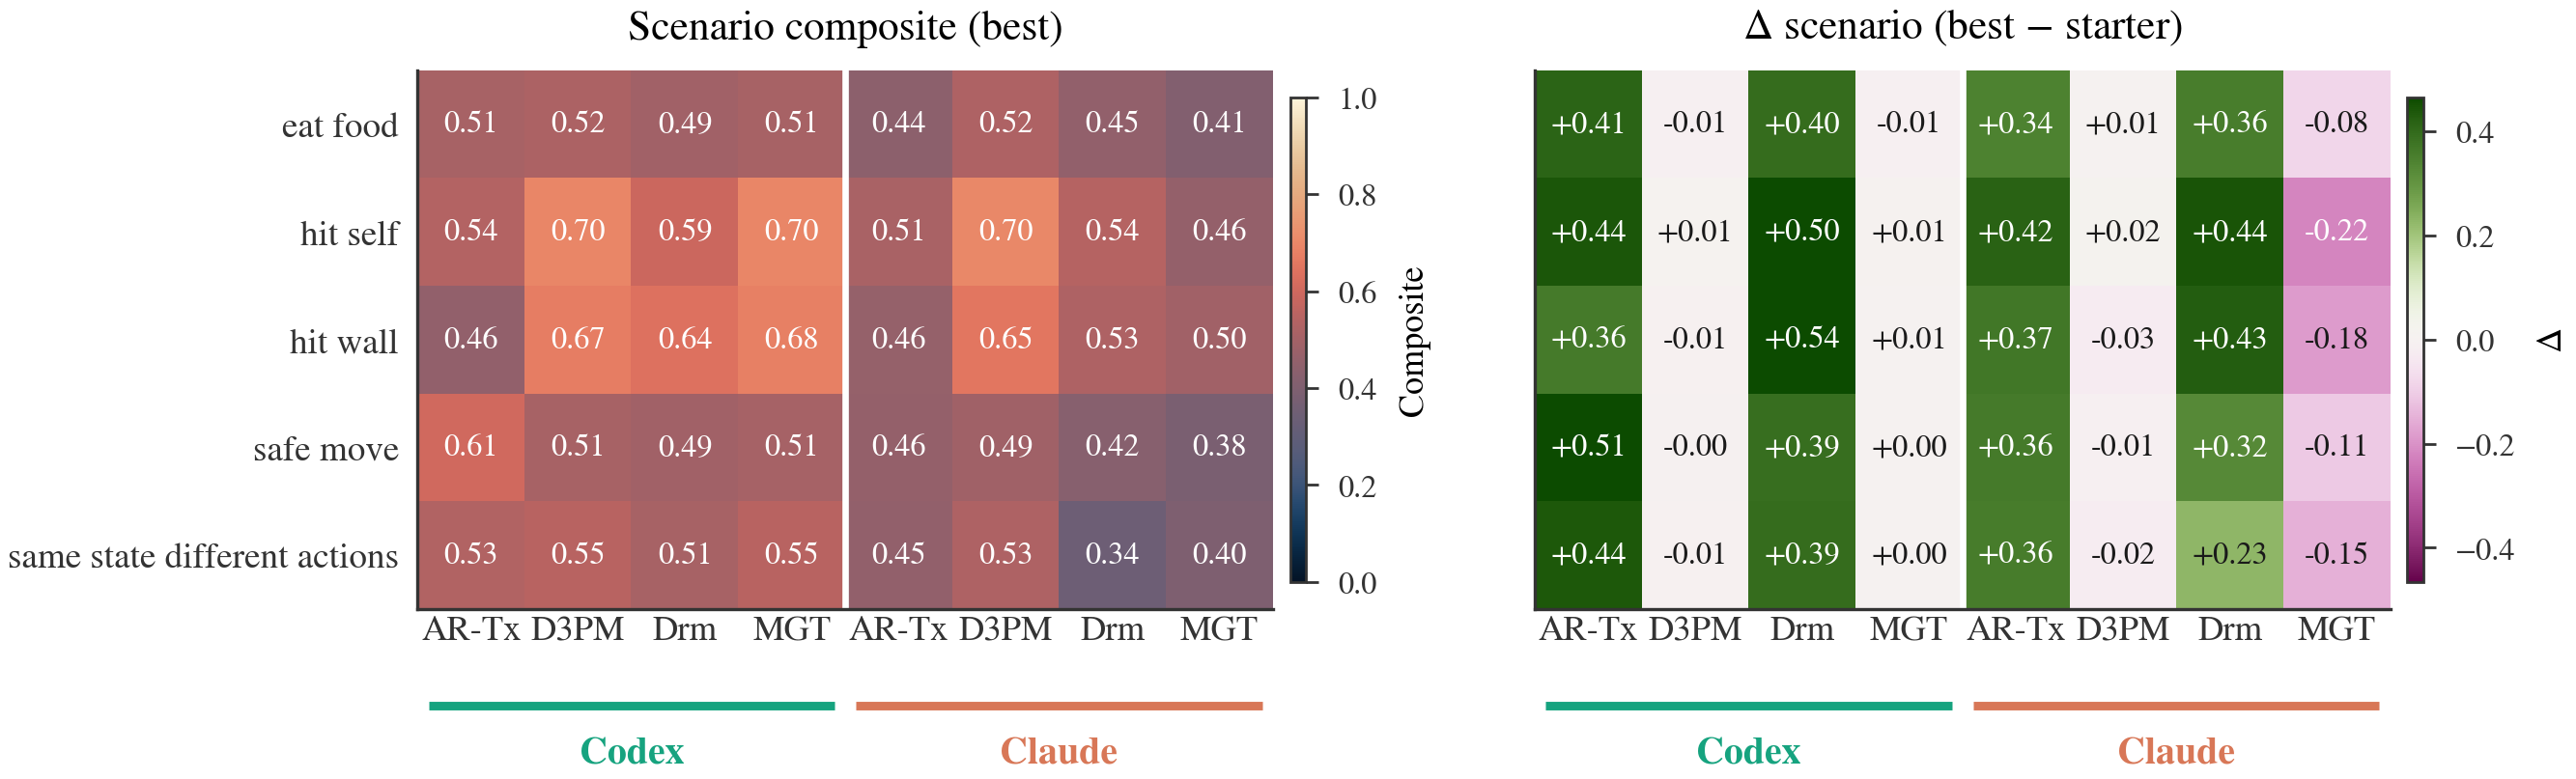
60 scenario groups across the 8 games (1,860 episodes). Each panel shows per-scenario starter → agent-best composite.

Each scenario constructs a controlled initial state that isolates a specific game mechanic (collision, scoring, terminal transition) and applies a deterministic action sequence.


What Wins? Taxonomy of Winning Edits

Every session winner is classified against the starter by a zero-shot judge. 91% of winners are non-trivial research-style edits (new objective, loss, rollout, architecture, data augmentation, or a combination), not hyperparameter tweaks.

LabelWinnersShare
ROLLOUT 9 14.1%
 
LOSS 18 28.1%
 
ARCHITECTURE 11 17.2%
 
MULTIPLE 4 6.2%
 
DATA_AUG 6 9.4%
 
INFERENCE 10 15.6%
 
HYPERPARAM 6 9.4%
 
BUGFIX 0 0.0%
 
INFRA 0 0.0%
 
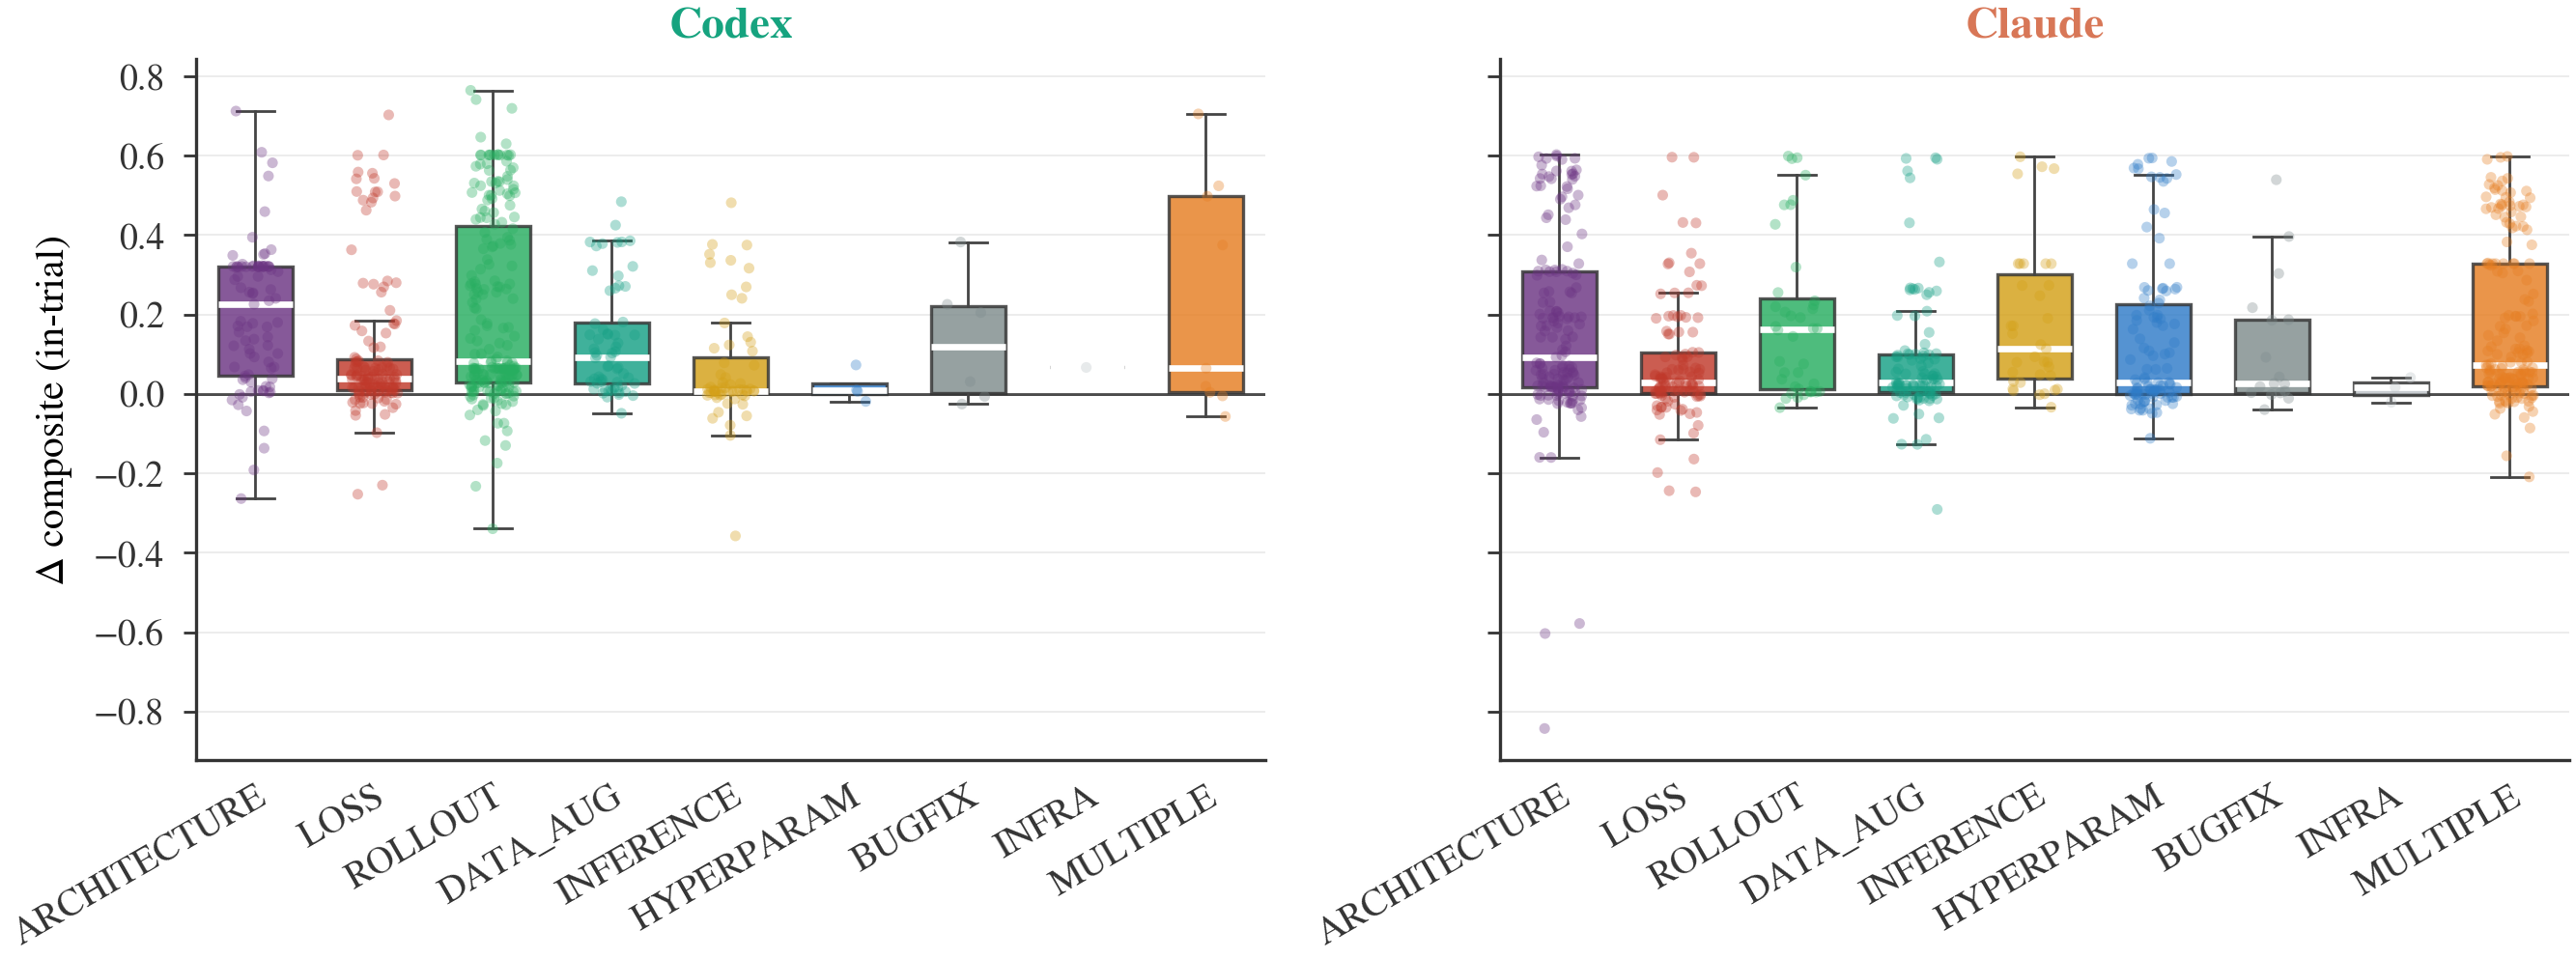
Label uplift heatmap

HYPERPARAM / BUGFIX / INFRA are counted as trivial; all other labels are non-trivial. Below: per-label uplift across the 1,335 classified experiments.


Session Progress

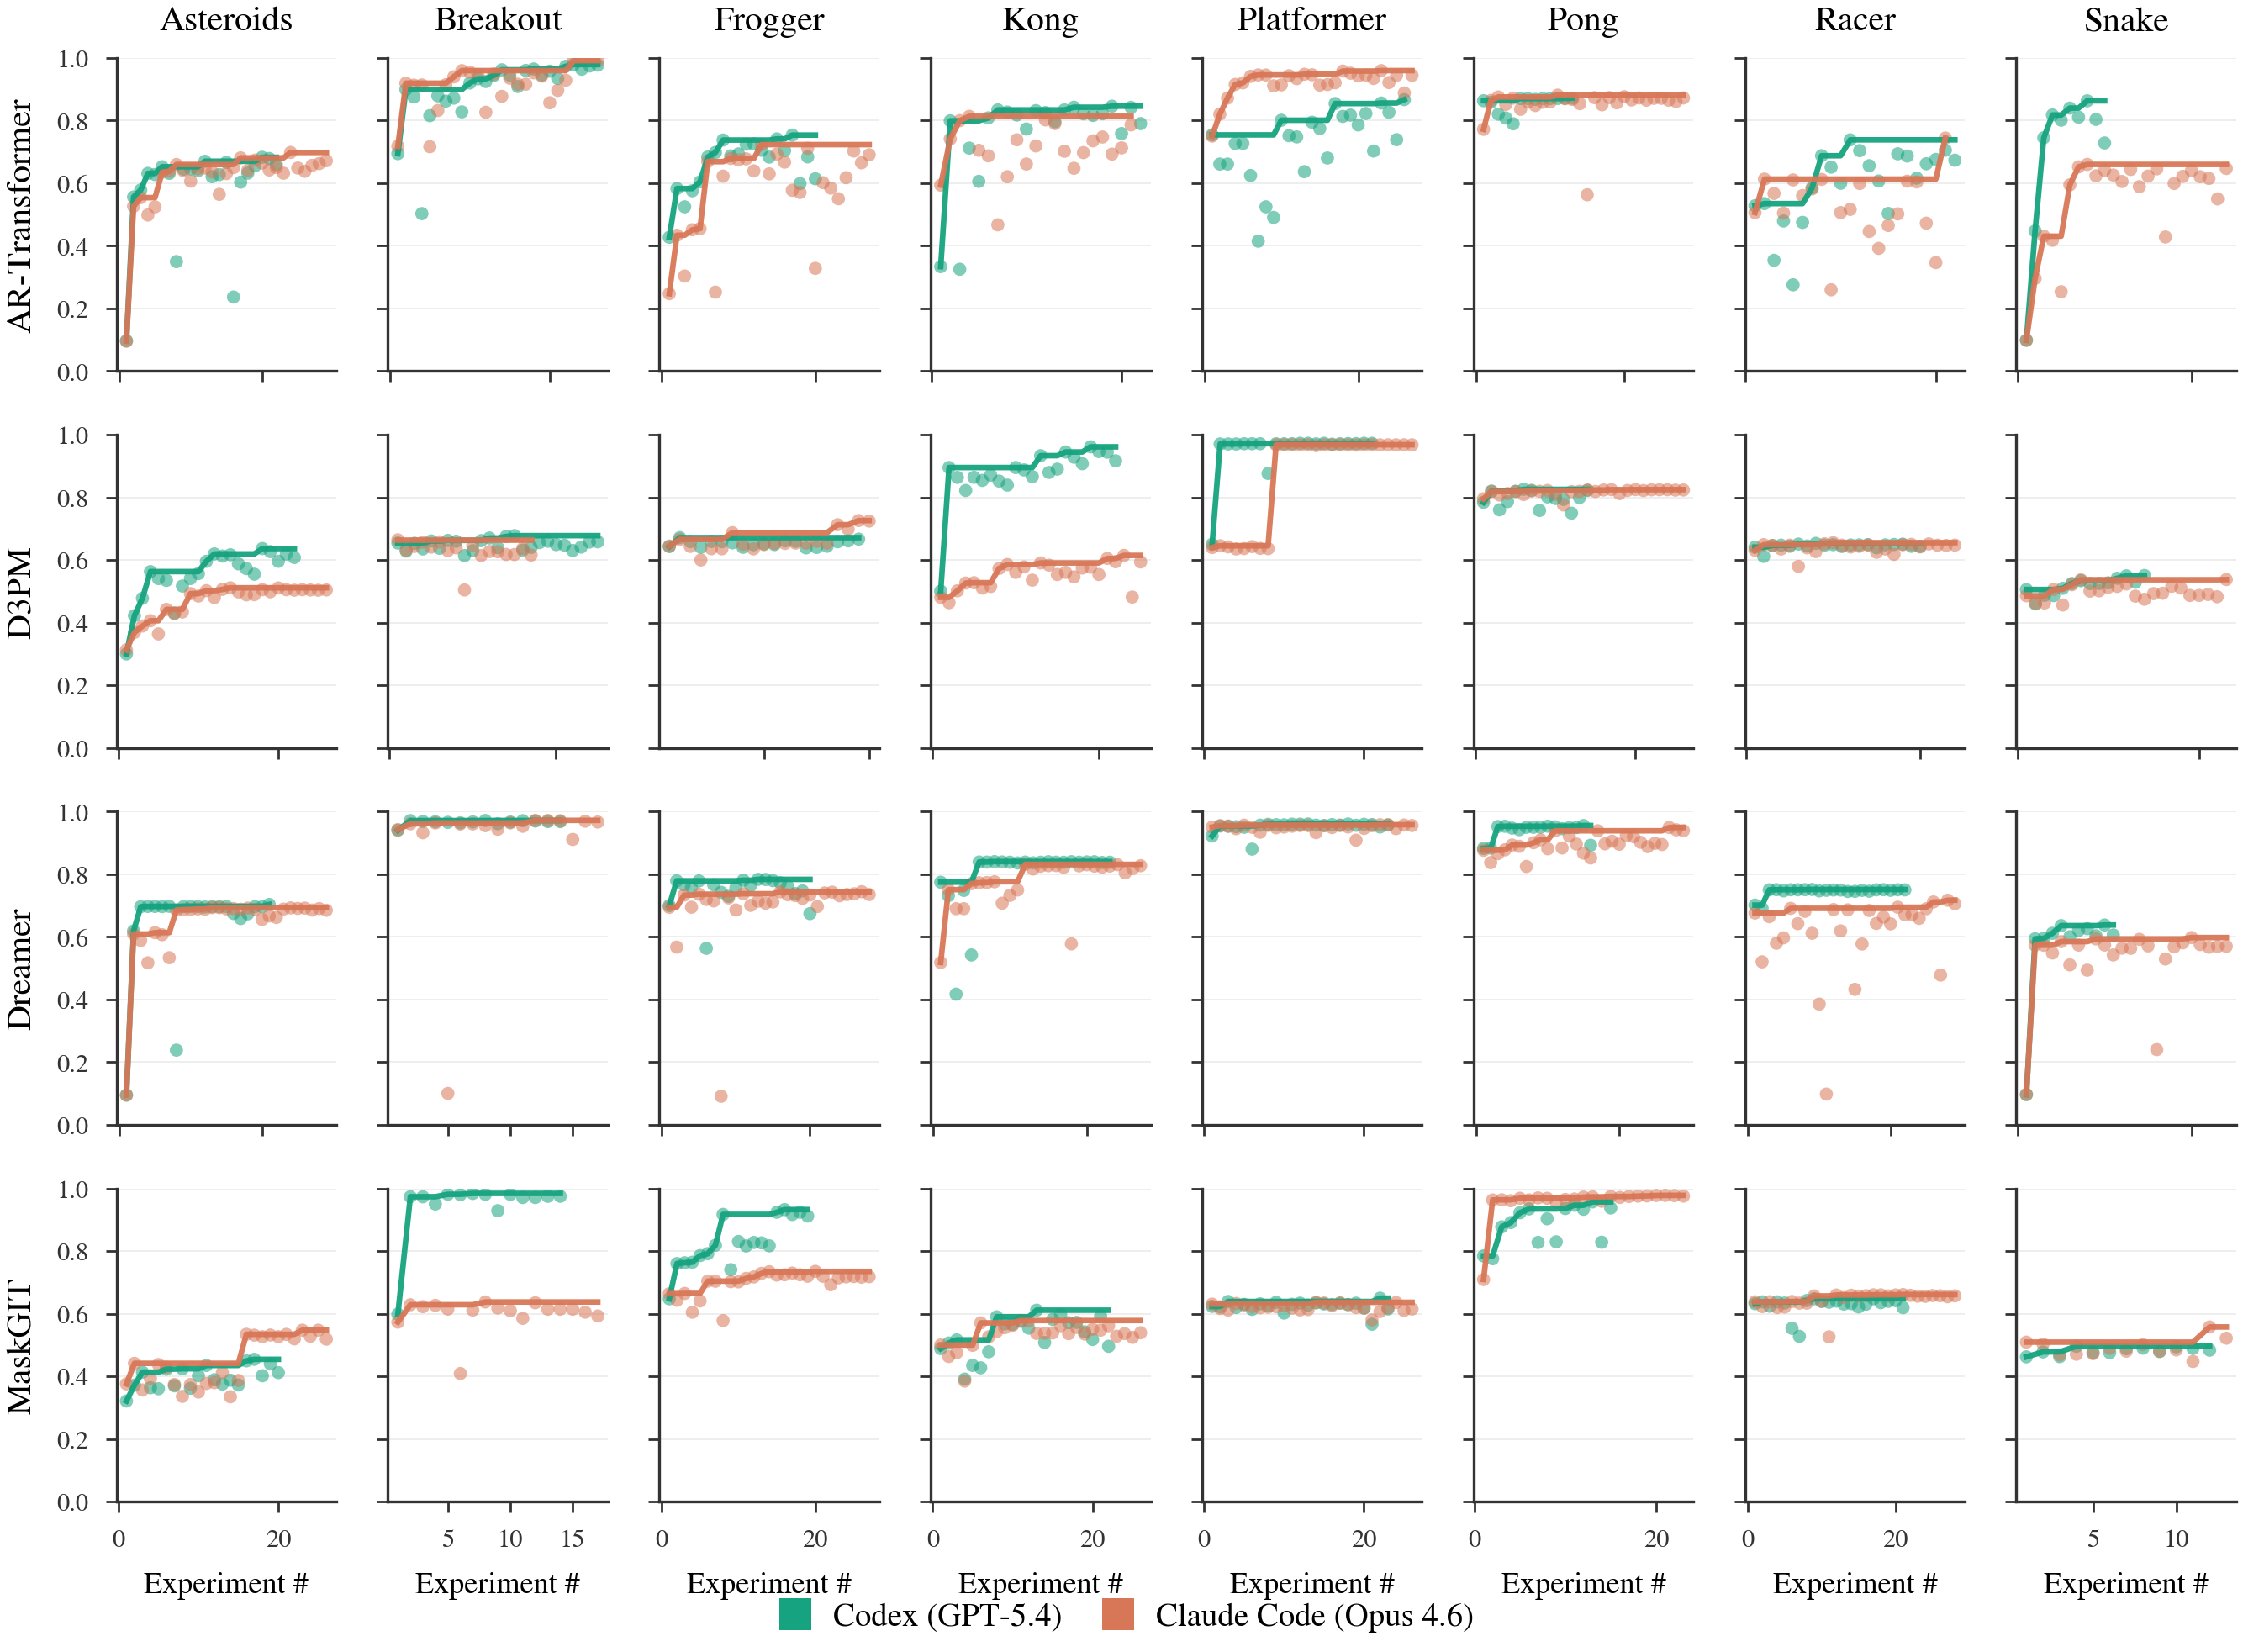
Best-so-far validation composite over the course of each 6-hour session, per (game, starter). Curves are step functions that only change when a new best is found. Held-out test scores are computed once at session end on the validation-selected checkpoint.

Session progress grid

Compute Budget

Number of experiments each agent completed per 6-hour session, aggregated across the 32 shared tasks. The per-experiment training cap is 600 s; the per-session wall clock is 6 h.

AgentTotal experimentsMean/sessionMedian/sessionRange
Opus-4.6 753 23.5 25 12-28
Codex-5.4 582 18.2 19 9-25

Opus runs more experiments per session because it persists natively across iterations; Codex's exec mode is wrapped in a restart loop (paper §D.2). Both receive the same 6-hour budget.

Dataset Statistics

Each game ships 19K episodes across four splits. Trajectories are stored as Parquet files with binary NumPy tensors (per-entity state, actions, rewards, terminals) plus a per-game meta.json.

8
Games
10K
Train / game
3K
Val / game
3K
Test / game
3K
Scenario / game
158M
Total frames

Getting Started

# Install
pip install -e .

# Prepare data (downloads from HuggingFace Hub)
python scripts/prepare_data.py --game pong

# Train a single task
cd tasks/pong_dreamer
python train.py

# Evaluate
python score.py